San Diego County study shows life expectancy differs sharply by community, reflecting unequal local conditions
Life expectancy varies by more than a decade inside San Diego County
Life expectancy in San Diego County is not uniform—and the community a person lives in can be associated with markedly different outcomes. In the County of San Diego’s 2023–2025 Community Health Assessment, overall life expectancy at birth for a baby born in 2022 is estimated at 80.8 years. Within the county, however, the assessment identifies a 12.5-year gap between some communities.
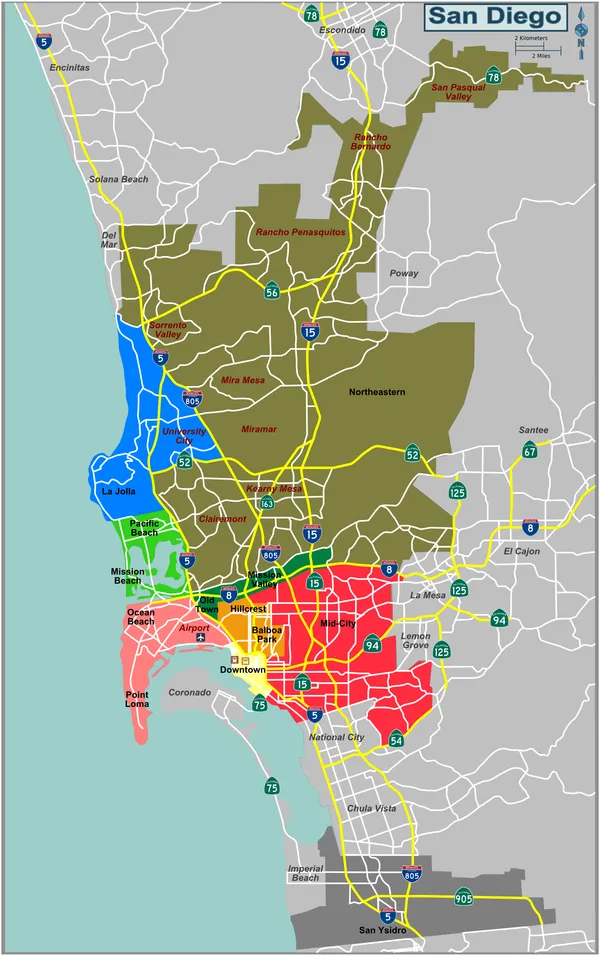
The assessment provides an example of this geographic divide: life expectancy in the Chula Vista Service Area is estimated at 75.3 years, compared with 87.8 years in the University Service Area. The findings align with a broad body of public-health research showing that place-based conditions—such as income, access to preventive care, environmental exposures, housing stability, and transportation—can influence longevity.
Geography, race and sex differences appear together in local data
The same county assessment reports substantial differences across racial and ethnic groups. It estimates life expectancy at 85.4 years among Asian residents and 72.8 years among Black residents, a 12.6-year gap. It also estimates a 5.4-year gap by sex, with males at 78.2 years and females at 83.6 years.
These measures are described as reflecting both overall mortality patterns and the long-term effects of health disparities. The assessment links variations to differences in public-health infrastructure and the distribution of resources, including medical care and other community supports.
What drives the gap: social and economic conditions tied to health
The county assessment emphasizes that longevity is associated with more than clinical care alone. It highlights that people are less likely to live longer when they are economically disadvantaged, get little exercise, or lack access to health care. It also notes that even when accounting for such factors, geography itself remains associated with health outcomes.
This focus is consistent with statewide tools used in California to map community conditions that correlate with life expectancy at birth, including education, job opportunities, and environmental quality.
How to interpret neighborhood-level life expectancy
Public-health researchers treat life expectancy estimates as population-level indicators rather than predictions for any one individual. The numbers describe average outcomes shaped by cumulative conditions over time, including differences in chronic disease risk, injury rates, and preventable causes of death.
- Countywide life expectancy at birth (2022 births): 80.8 years
- Example community estimates: 75.3 years (Chula Vista SRA) vs. 87.8 years (University SRA)
- Reported gaps: 12.5 years between some communities; 12.6 years between Asian and Black residents; 5.4 years between females and males
Life expectancy is widely used as an indicator of the capability to live a long and healthy life and as a snapshot of the long-term impact of health disparities.
Taken together, the data point to a central conclusion: in San Diego County, longevity is closely connected to local living conditions, and those conditions are not distributed evenly across communities.